
Maricopa County · Chandler, Arizona
Chandler homes for sale
Every active Chandler listing, live from the MLS, with the numbers behind them.
The short answer
As of October 30, 2026, there are 721 homes, condos, and townhomes listed for sale in Chandler, with a median list price of $550,000. Over the past 12 months, 2,897 Chandler homes sold at a median price of $520,000, or $287 per square foot, after a median of 46 days on market. Homes closed at a median of 98.68% of their final list price. With about 3.0 months of supply, the market is leaning toward sellers.
Source: ARMLS via Flexmls, calculated by Arizona Luxury Partners. Figures cover single-family homes, condos, townhomes, and patio homes with a Chandler address in the MLS, as explained in the FAQ below.
The Chandler market, by the numbers
Closed residential sales, October 30, 2025 to October 30, 2026.
Months of supply is today's 721 listings divided by the 12 month average of about 241 sales per month. 227 of the 2,897 sales closed at $1 million or more. Seller concessions are seller paid buyer costs, such as closing costs or a rate buydown, as reported on the closed MLS record.
Chandler median sale price, 10 years
Yearly median sale price of closed residential sales, 2016 to 2026.
The median sale price for homes with a Chandler address went from $270,000 in 2016 to $530,000 in 2025, up 96%. The highest yearly median was $530,000 in 2024. So far this year, through October 29, 2026, the median is $520,000. A median is the middle sale of the year, so it moves with both prices and the mix of homes that sold. Ask us how values have changed for homes like yours.
See the yearly numbers
| Year | Median sale price | Homes sold |
|---|---|---|
| 2026 (through October 29, 2026) | $520,000 | 2,410 |
| 2025 | $530,000 | 2,862 |
| 2024 | $530,000 | 2,729 |
| 2023 | $505,000 | 2,708 |
| 2022 | $525,000 | 3,557 |
| 2021 | $455,000 | 4,974 |
| 2020 | $366,000 | 5,063 |
| 2019 | $325,000 | 4,919 |
| 2018 | $310,000 | 5,006 |
| 2017 | $290,000 | 5,047 |
| 2016 | $270,000 | 5,210 |
Source: ARMLS via Flexmls. Closed residential sales by calendar year, calculated by Arizona Luxury Partners.
Search Chandler homes for sale
Updated continuously from the MLS. Filter, save, and tour any home.
What the numbers mean right now
Our read on the market, for buyers and for sellers.
Over the past 12 months, 2,897 homes with a Chandler address sold, and 8% of them closed at $1 million or more. Today 721 are listed for sale, and 435 of those have already had a price change.
Pricing is where homes win or sit. 960 of last year's sales, or 33%, went under contract within 30 days, at about 99% of list price on average. 421, or 15%, took more than 120 days, and those closed at about 90% of their original list price on average.
If you are buying
- The typical home sold about 3% below its original list price, so there is room to negotiate on homes that have been listed a while.
- 53% of sales included a seller concession. Ask about closing costs or a rate buydown as part of your offer.
- Compare a home against recent sales in the same neighborhood and price range, not Chandler as a whole.
- Get pre-approved first so you can act quickly when the right home comes up.
If you are selling
- Your first month matters most. Homes that sold within 30 days closed at about 99% of list price on average.
- Homes that sat more than 120 days closed at about 90% of their original list price, so pricing right at the start pays.
- Price against recent sales in your own neighborhood, and show how your home compares on size, lot, and updates.
- We can show you the exact sales we would use to price your home.
About Chandler
Homes, land, and amenities in Chandler, Arizona.
Chandler covers flat east Valley land southeast of downtown Phoenix. Homes include a historic downtown core, master planned and lake communities, and suburban subdivisions.
- Population
- 278,748 (2025 Census estimate), 275,987 in the 2020 Census
- Land area
- 65.30 square miles
- School districts
- Chandler Unified, Kyrene, Tempe Union High, Mesa Public Schools, and Gilbert Public Schools
- Median home size sold
- 1,837 square feet over the past 12 months
- Listings with a price change
- 435 of 721 active listings
- Official site
- City of Chandler
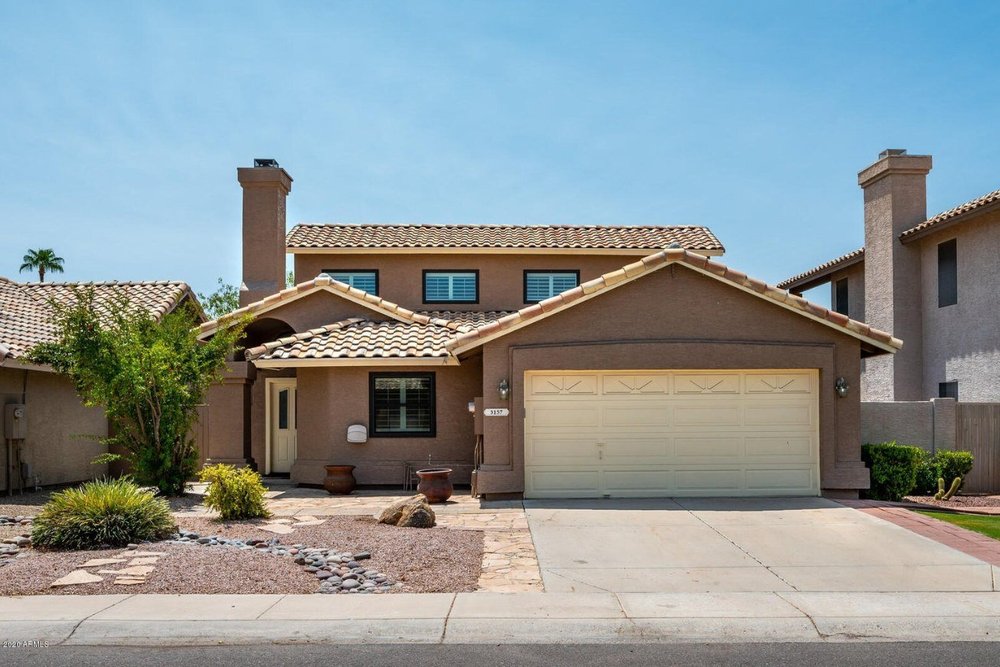
Chandler homes we have helped clients buy and sell
White-glove service at every price point.
Nearby areas
Compare Chandler with other places we work.
Chandler questions, answered
How much do homes cost in Chandler?
The median sale price was $520,000 for the 2,897 homes, condos, and townhomes with a Chandler address that sold from October 30, 2025 to October 30, 2026, or $287 per square foot. Homes listed for sale on October 30, 2026 had a median list price of $550,000.
How many homes are for sale in Chandler right now?
As of October 30, 2026, 721 homes, condos, and townhomes with a Chandler address were listed for sale in the MLS. The search on this page updates continuously, so it always shows the current count.
How fast do homes sell in Chandler?
Homes that sold over the past 12 months spent a median of 46 days on the market and closed at a median of 98.68% of their final list price, or 97.06% of their original list price.
Is Chandler a buyer's market or a seller's market?
With 721 listings today and about 241 sales a month over the past year, Chandler has about 3.0 months of supply, which is leaning toward sellers. Conditions vary a lot by price range and neighborhood, so ask us for the numbers on the homes you are considering.
How common are seller concessions in Chandler?
1,530 of the 2,897 closed sales, or 53%, reported a seller concession on the MLS record, such as seller paid closing costs or a rate buydown.
What school districts serve Chandler?
Chandler is served by Chandler Unified, Kyrene, Tempe Union High, Mesa Public Schools, and Gilbert Public Schools. Boundaries do not always follow city lines, so confirm the assigned schools for a specific address with the district.
How have Chandler home prices changed over the past 10 years?
The median sale price for homes with a Chandler address was $270,000 in 2016 and $530,000 in 2025, up 96%. The highest yearly median in that span was $530,000 in 2024. So far this year, through October 29, 2026, the median is $520,000.
How does this page define Chandler?
Our search and statistics include residential listings, meaning single-family homes, condos, townhomes, and patio homes, whose MLS city is Chandler. The MLS city is the mailing address city, which does not always match city limits. Figures were calculated by Arizona Luxury Partners from ARMLS data on October 30, 2026.
Thinking about Chandler?
Your vision, your home, our expertise.
Tell us what you are looking for and we will send new Chandler listings that fit, along with the sales data behind each one. Our office is on Pima Road in north Scottsdale. White-glove service at every price point.
Your advisors
602.814.7266
kyle@azluxurypartners.com
License BR665419000
Meet Kyle
480.510.7689
art@azluxurypartners.com
License BR014102000
Meet Art
Arizona Luxury Partners | Real Estate Group at RE/MAX Fine Properties
Sources
- ARMLS via Flexmls. Residential closed sales October 30, 2025 to October 30, 2026, and active listings on October 30, 2026, for listings whose MLS city is Chandler. Medians and months of supply calculated by Arizona Luxury Partners.
- Population and land area: U.S. Census Bureau, accessed October 30, 2026.
- City information: City of Chandler, accessed October 30, 2026.
- ARMLS via Flexmls. Residential closed sales for each calendar year from 2016 through October 29, 2026, for listings whose MLS city is Chandler, used for the 10 year median sale price chart.
- School districts: Wikipedia, Chandler, Arizona, accessed October 30, 2026.
All information provided is deemed reliable but is not guaranteed and should be independently verified. Listing information is provided by the Arizona Regional Multiple Listing Service and may not reflect all real estate activity in the market. Population and land area come from the U.S. Census Bureau. School district boundaries can change, so confirm the assigned schools for a specific address with the district. This page is for general information only and is not financial, lending, legal, or tax advice. Arizona Luxury Partners | Real Estate Group at RE/MAX Fine Properties, 21020 N. Pima Road, Scottsdale, AZ 85255. Office 480.766.1515. Brokerage License LC629808000. Equal Housing Opportunity.
